Building Your Own Wave Analyser/Oscilliscope, Use LabVIEW or Any Sound analyser for Output
Yes, you read it right, you can make your own Wave Analyser or in simple terms, an Oscilloscope, that too costing less than 1$ (1 Dollar). An oscilloscope, if you are looking for it in the market, you will obviously get it, but you have to spend a heavy amount from your pocket on it.
The secret behind our oscilloscope costing much less than a regular one, is using many readily available things that are available with every electronics hobbyist.
Things you’ll need to start with this oscilloscope are
# Your Computer's Sound Card (connection through Line-In Port)
# Your Computer's Sound Card (connection through Line-In Port)
# Wires (prefer metal shielded cables)
# Some Resistors
# A 3.5 audio jack ( which can be taken form a dead earphone )
# A Zener diode
Yes that's all you are going to need for it!
Before you go further, we suggest you to have a glance on how 3.5mm Jack or TRS Connector works. Just follow this link for that, http://www.divilabs.com/2013/03/how-do-35mm-jacks-trs-connectors-works.html.
Now we hope that you have got some idea (conceptually), how your oscilloscope gonna work! Its all about measuring voltage across the Tip, Ring & Sleeve of your 3.5 mm jack or TRS connector.
NOTE: A stereo extension cable for earphones can be taken if one does not have a cable available. The stereo cable plugs into the "line in" jack on the sound card of your computer system.
So lets proceed with how you are going to make the connection of this oscilliscope....
 |
| 3.5 mm Jack or TRS Connector as Wave Analyser or Oscilloscope |
Important Design Considerations:
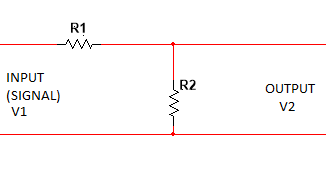
Sound cards are designed only to accept in a range of one volt or two so we used a voltage divider mechanism, rather than connecting wires directly to it, to limit voltage going towards the sound card, two pairs of resistor of ¼ watts which acting as a voltage divider. The voltage across each channen can be just calculated by the simple formula V2= (R1/(R1+R2))V1, as illustrated in the figure...
 |
| Voltage Divider considerations for our oscilloscope |
In our oscilloscope, the 10k resistor will be R1 & the 91k will be acting as R2 of the voltage divider circuit above mentioned. Here the Channel 1 & 2 have a common ground connection, and thus in "Stereo" mode you will be able to have a "dual channel" oscilloscope. If we just want only one Channel, either don't connect the other channel or use this connection in "Mono" Mode instead of "Stereo".
 |
| 3.5 mm jack connection for our Common Man's Oscilloscope ( Solder connection should be like this, channel 1 & 2 are interchangeable) |
Analysis Of Waves
Signal is acquired through sound card, processed and sampled inside the sound card and fed to the computer , can be displayed on various sound analyzing tools such as soundcard oscilloscope .
Or any other sound editing software, that support recording or gathering the data from Line In port of your computer's sound card. Open source software like Audacity can also do it effectively, there you will even get the option to set the sampling rate & the MONO & STEREO mode use of this.
Signal is acquired through sound card, processed and sampled inside the sound card and fed to the computer , can be displayed on various sound analyzing tools such as soundcard oscilloscope .
 |
| A Snapshot Of "Scope" interface ( Sound card Oscilloscope), aka Common Man Oscilloscope |
Commercially available oscilloscope has a very high sampling rate, & this oscilloscope it is limited to 96 Khz /24-bit to 192 khz /32-bit data (maximum sampling rate of sound card) .
If you are a NI LabVIEW user, you can also use this software to create a VI, that will be used to gather the voltage data across the Channels of your oscilloscope.
 |
| NI LABVIEW Snapshot of Acquisition of Voltage of Our Common Man Oscilloscope, Through 3.5 mm jack |
Here you can find the option to select your oscilloscope as a MIC. #Channels will give you the options to make your oscilloscope work as in Single or Dual Channel mode. In the figure the Channel 1 of the oscilloscope data is displayed in white colors & Channel 2 in Red colors. You can even control the Duration of the data to be analyzed & required sampling rate too.
After clicking OK, just you have to connect the Output of the "Acquire Sound" Module to a graph display available as an option there.
So we hope that you had a wonderful time reading through this short article, we will be back very soon with some more new stuffs like that...So stay tuned & updated....!
-TEAM Digital iVision Labs!
